Tags and Basic Alerts
Dynamic tags contain custom terms that enable easy searching and filtering for events that matter the most to your business. Basic real-time Alerts are built using these custom tags and are set to notify you and your team based on specific thresholds and preferences. Users can select to be notified with real-time Alerts via Slack, PagerDuty, HipChat, Campfire, iPhone app, or Webhook.
Additional functionality includes powerful advanced Alerting functions. More information about our advanced Alerts as well as other useful resources can be found below:
- Anomaly detection - Real-time alerting based on deviations from important patterns and log events.
- Inactivity alerting - Monitor specific incoming log events and patterns, and receive real-time alerts on inactivity or system behavior changes.
- Team annotations - Add notes, commentary and context to live log data for team-wide visibility and intelligence about what is happening across the systems.
- Regular Expression keyword search - Regular Expressions can be used to specify patterns for Tag & Alerts.
Creating a tag
- Select Manage Alerts from the Alerts dropdown menu from the top Navigation bar.
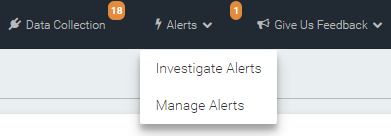
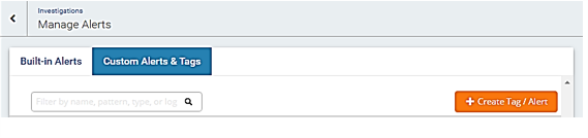
- The Manage Alerts dialog displays.
- Click the Custom Alerts & Tags tab.
- Click the + Create Tag/Alert button.
- When the Create New Tags And Alerts dialog appears, enter the following:
- Tag Name: Defines the name that displays in the Tag list.
- Pattern: Defines the query used to match the log events that should be tagged. Logical operators like ‘AND’ must be uppercase. Pattern field should not contain the
where()clause. - Label: This is how the tag displays in your logs. Create a new label by clicking the Create New Label button. The Associate Labels to Tag dialog allows you to enter the Label's name and pick a color for the Label. You can also choose a custom color for your label.
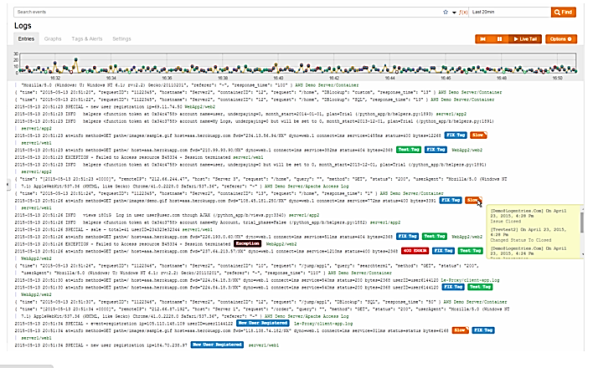
Using a tag as a filter
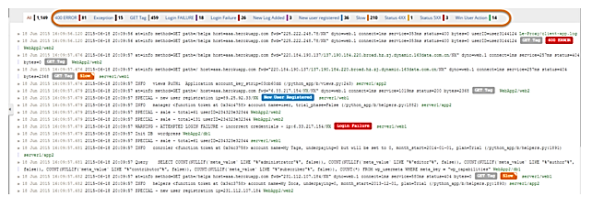
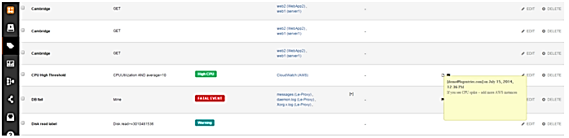
Tags provide a visual cue in your log event to help you identify important events. Additionally, tags can be used as filters.
When looking at tags in your log data, the tags that have occurred in the current time frame are listed across the top of the log data. The number next to the tag names represents the number of occurrences of that tag in the given time frame.
Creating an Alert
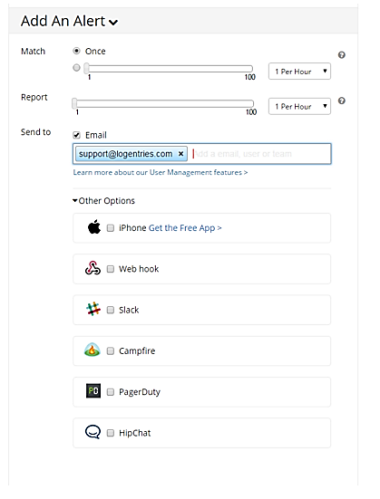
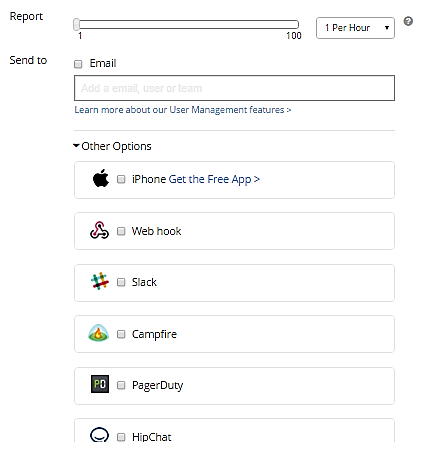
Alerts automatically notify you when important events happen within your system. To create an alert, you must define the following:
- Match - Defines how many times the event must occur in a given time frame to trigger an Alert.
- Report - Sets a limit for the maximum amount of Alert notifications you want to receive in the selected time frame.
- Send to - Sends the Alert to any email address or choose another pre-integrated method such as Slack, PagerDuty, HipChat, Campfire, iPhone app, or Webhook.
Anomaly detection
Anomaly Detection is part of the tagging and alerting functionality. It gives users the ability to alert based on positive or negative changes within the parameters of a search query over time.
To use the Anomaly Detection capabilities, navigate to Tags & Alerts at the top of the UI and select Anomaly Alert.
Clicking one of the tag names from the top bar applies a filter so that only log events that meet the pattern for the specified tag are shown.
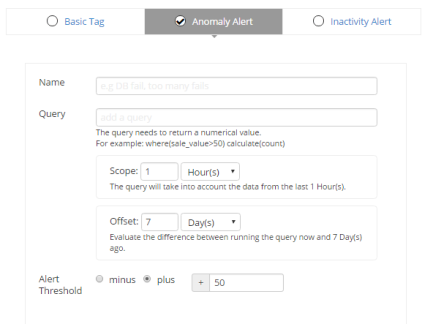
Anomaly Detection fields and descriptions
- Alert Name: This is a unique name that identifies the Alert.
- Query: This is the query that the Alert triggers on. Using our easy to construct search language, customers can create custom queries to alert on.
Examples
status = 200 calculate(AVERAGE) – This calculates the average number of 200 responses in a web server. If this number drops below a certain percentage of norm (say 95%), an Alert could notify the operations team that the web server may be having issues.
status = 200 AND responsetime > 5 calculate (AVERAGE) – This adds response time to the query to allow for even great Anomaly detection.
Range: This is the time range that the threshold is applied to. The range compares the current log entries to the delta that occurred 7 days ago. For example, if you choose 1 hour, it compares this current log entry to the same threshold that occurred exactly one week ago.
Threshold: Negative or positive percentage change over the base search results. As search results are calculated from a query, a change in the threshold defined causes an Alert. For instance, in the example above, if you’re calculating response time of a web app, a 5% increase (Plus) in response time average may warrant an Alert to the operations team.
The remainder of the Anomaly Alert configuration process is similar to our basic tags and alerts. You can choose how often this alert and the type of notification sent (e.g. email, iPhone, Webhook etc.).
Inactivity Alerting
Inactivity alerting notifies you when a pattern or an entire log or group of logs becomes inactive for a given time period.
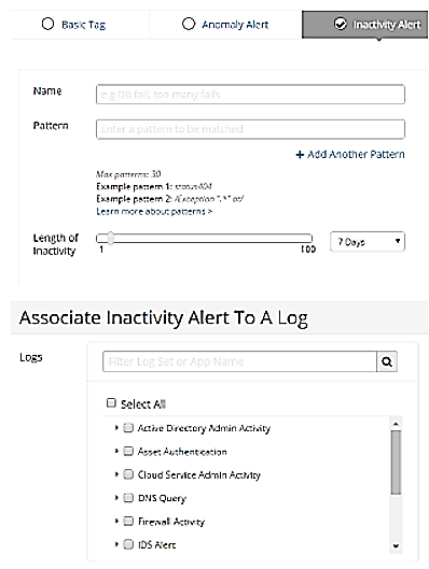
To create an Inactivity Alert, navigate to Tags & Alerts, select Create Tag / Alert and select Inactivity Alert from the list of tabs. You'll need to specify the following:
- Tag Name - The name used to identify the Tag.
- Pattern - The pattern to match in the Inactivity Alert. The pattern may contain regular expressions or our search language, including advanced functions. If this field is left blank, it defaults to .* and alerts on any entry within the log(s). This is optional.
- Timeframe - The amount of time that must elapse for a notification to be triggered if no data appears in the log. (e.g., if set to 5 minutes and a log event occurs every 4 minutes, no Alert is fired)
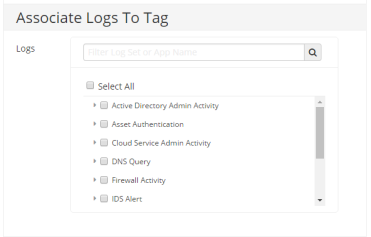
- Logs - The log(s) this Alert is applied too.
Inactivity Alerting monitors each log individually, for example, the Alert is monitoring a specific event across two logs. If the event occurs in the first log but not the second in the given time frame, the Alert is triggered for the second log.
The remainder of the Inactivity Alert configuration process is similar to basic tags and alerts. You can choose how often this alert and the type of notification sent (e.g. email, iPhone, Webhook etc.).
Team annotations
Shareable Log Annotations enable you to add notes to tags and live log events, as well as the ability to assign the annotation to members of your team. They provide an easy-to-use communication and workflow tool for managing and tracking issue resolution within your logs, as well as maintain a historical account of log-specific communication to improve team-wide visibility and time to resolution.
Every organization needs to have the ability to track and manage the assignment of current issues within their logs, as well as maintain the historical information for future resolution. By using annotations, a team member can add specific notes and commentary on the incident, assign it to themselves or another team member, and set the workflow status to ‘in progress’, ‘pending’ or ‘closed’. As information and knowledge is gathered about the issue, further notes and comments can be added. When the issue is resolved, the Annotation remains so that if it reappears allowing the next user investigating the issue to have access to all the historical data stored within the annotation.
Annotations are added and maintained in the Tags and Alerts section. When editing an existing tag, you have the ability to add an annotation to the tag itself.
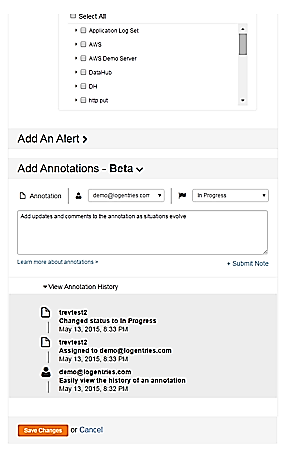
Annotations
Annotations become a permanent element of the Tag so that historical information is maintained. Once created, the annotations show up in both the Tag and Alerts view as well as at the log event level.
- Annotations are similar to tags and alerts, except annotations occur in real time.
- Any number of annotations can be added to a tag.
- Annotations cannot be removed from a tag.
Once added to a tag, the annotation is viewable by all users of your account. However, it can be assigned to someone specifically for further comments.