Running an unscheduled scan at any given time may be necessary in various situations, such as when you want to assess your network for a new zero-day vulnerability or verify a patch for that same vulnerability. This section provides guidance for starting a manual scan and for useful actions you can take while a scan is running:
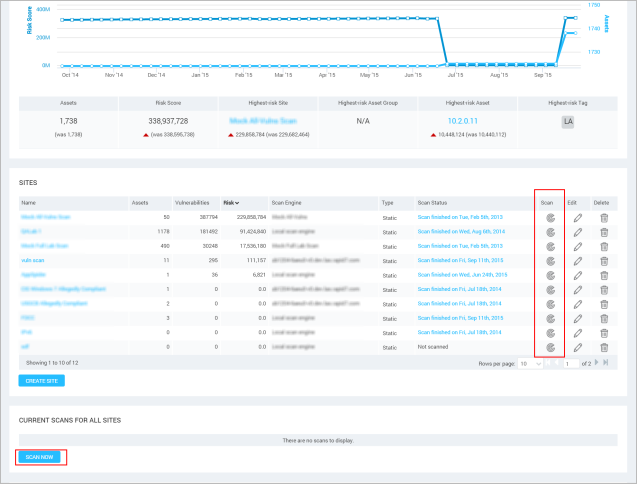
To start a scan manually for a site right away from the Home page, click the Scan icon for a given site in the Site Listing table of the Home page. Or click the Scan button that appears below the table labeled Current Scans for All Sites.
Starting a manual scan
Or, you can click the Scan button on the Sites page or on the page for a specific site.
Scanning a single asset at any given time can be useful. For example, a given asset may contain sensitive data, and you may want to find out right away if it is exposed with a zero-day vulnerability.
To scan a single asset, go to the page for that asset by linking to it from any Assets table on a site page, asset group page, or any other pertinent location. Click the Scan asset now button that appears below the asset information pane.

Starting a scan for a single asset
With asset linking enabled, an asset in multiple sites is regarded as a single entity. See Linking assets across sites for more information. If asset linking has been enabled in your InsightVM deployment, be aware of how it affects the scanning of individual assets.
With asset linking, an asset will be updated with scan data in every site, even if the user running the scan does not have access to at least one of the sites to which an asset belongs. For example: A user wants to scan a single asset that belongs to two sites, Los Angeles and Belfast. This user has access to the Los Angeles site, but not the Belfast site. But the scan will update the asset in the Belfast site.
Blackouts are scheduled periods in which scans are prevented from running. With asset linking enabled, if you attempt to scan an asset that belongs to any site with a blackout currently in effect, the Security Console displays a warning and prevents the scan from starting. If you are a Global Administrator, you can override the blackout.
When you start a manual scan, the Security Console displays the Start New Scan dialog box.
In the Manual Scan Targets area, select either the option to scan all assets within the scope of a site, or to specify certain target assets. Specifying the latter is useful if you want to scan a particular asset as soon as possible, for example, to check for critical vulnerabilities or verify a patch installation.
Note: You can only manually scan assets that were specified as addresses or in a range.
If you select the option to scan specific assets, enter their IP addresses or host names in the text box. Refer to the lists of included and excluded assets for the IP addresses and host names. You can copy and paste the addresses.
Note: If you are scanning Amazon Web Services (AWS) instances, and if your Security Console and Scan Engine are located outside the AWS network, you do not have the option to manually specify assets to scan. See Inside or outside the AWS network?.
Several configuration settings can expand your scanning options:
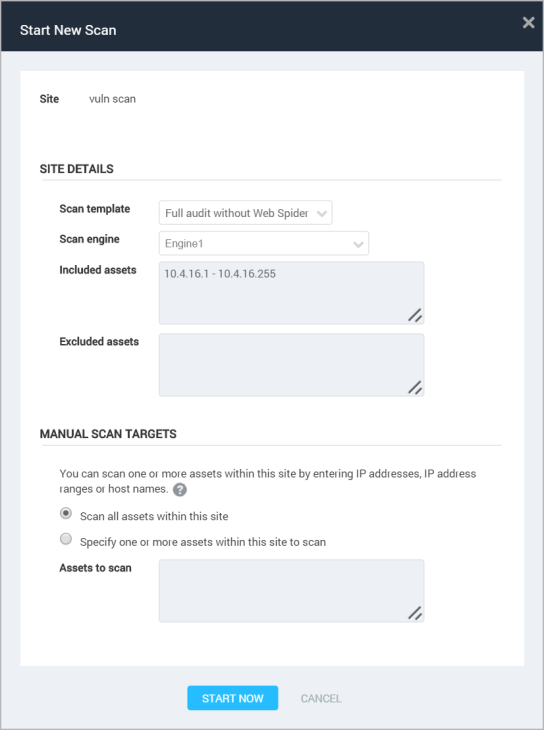
The Start New Scan window
Click the Start Now button to begin the scan immediately.
Note: You can start as many manual scans as you want. However, if you have manually started a scan of all assets in a site, or if a full site scan has been automatically started by the scheduler, the application will not permit you to run another full site scan.
When the scan starts, the Security Console displays a status page for the scan, which will display more information as the scan continues.
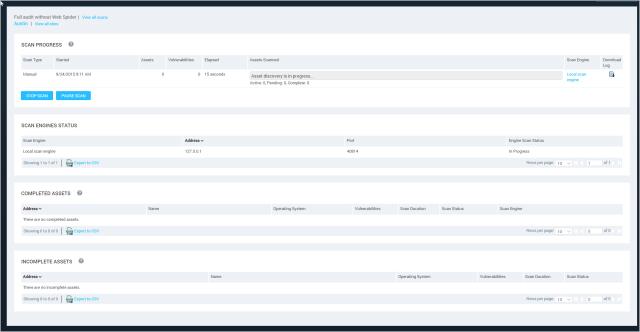
The status page for a newly started scan
When a scan starts, you can keep track of how long it has been running and the estimated time remaining for it to complete. You can even see how long it takes for the scan to complete on an individual asset. These metrics can be useful to help you anticipate whether a scan is likely to complete within an allotted window.
You also can view the assets and vulnerabilities that the in-progress scan is discovering if you are scanning with any of the following configurations:
If your scan includes asset groups and more than one Scan Engine is used, the table will list a count of Scan Engines used.

Scan progress table with multiple Scan Engines
Viewing these discovery results can be helpful in monitoring the security of critical assets or determining if, for example, an asset has a zero-day vulnerability.
To view the progress of a scan:
OR

The progress links for scans that are currently running
You will also find progress links in the Site Listing table on the Sites page or the Current Scan Listing table on the page for the site that is being scanned.
When you click the progress link in any of these locations, the Security Console displays a progress page for the scan.
At the top of the page, the Scan Progress table shows the scan’s current status, start date and time, elapsed time, estimated remaining time to complete, and total discovered vulnerabilities. It lists the number of assets that have been discovered, as well as the following asset information:
These values appear below a progress bar that indicates the percentage of completed assets. The bar is helpful for tracking progress at a glance and estimating how long the remainder of the scan will take. .
You can click the icon for the scan log to view detailed information about scan events. For more information, see Viewing the scan log .
The Completed Assets table lists assets for which scanning completed successfully, failed due to an error, or was stopped by a user.
The Incomplete Assets table lists assets for which the scan is pending, in progress, or has been paused by a user. Additionally, any assets that could not be completely scanned because they went offline during the scan are marked Incomplete when the entire scan job completes.
Note: If a scan failed to complete and restarted, you may temporarily see duplicate entries for the same scan - one for the failed attempt and another for the new scan that has yet to complete.
These tables list every asset's fingerprinted operating system (if available), the number of vulnerabilities discovered on it, and its scan duration and status. You can click the address or name link for any asset to view more details about, such as all the specific vulnerabilities discovered on it.
The table refreshes throughout the scan with every change in status. You can disable the automatic refresh by clicking the icon at the bottom of the table. This may be desirable with scans of large environments because the constant refresh can be a distraction.
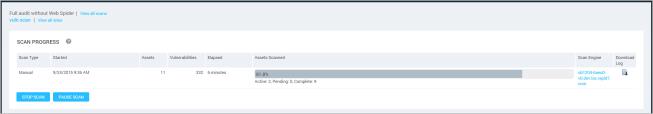
A scan progress page with a single Scan Engine used
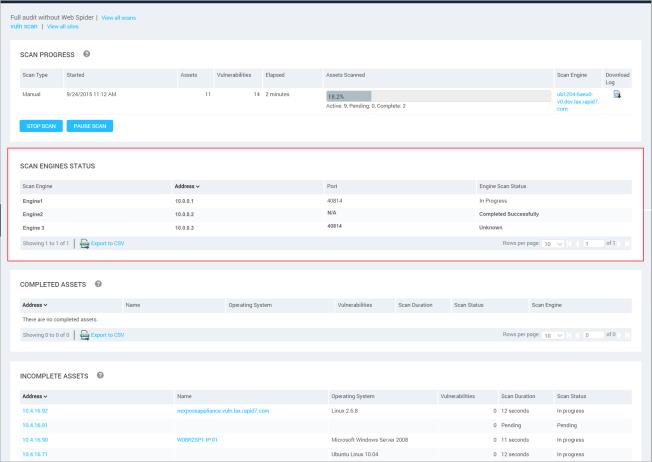
A scan progress page with multiple Scan Engines used
The scan progress page also reports the status of the Scan Engine used for the site.
If you are scanning an asset group that is configured to use the Scan Engine most recently used for each asset, you may see statuses reported for more than one Scan Engine. For more information, see Determining how to scan each asset when scanning asset groups .
The Status column reports the status of the Scan Engine. These statuses correspond to the scan states. See Understanding different scan states. An additional possible Scan Engine status is:
It is helpful to know the meaning of the various scan states listed in the Status column of the Scan Progress table. While some of these states are fairly routine, others may point to problems that you can troubleshoot to ensure better performance and results for future scans. It is also helpful to know how certain states affect scan data integration or the ability to resume a scan. In the Status column, a scan may appear to be in any one of the following states:
In progress: A scan is gathering information on a target asset. The Security Console is importing data from the Scan Engine and performing data integration operations such as correlating assets or applying vulnerability exceptions. In certain instances, if a scan’s status remains In progress for an unusually long period of time, it may indicate a problem. See Determining if scans with normal states are having problems.
Completed successfully: The Scan Engine has finished scanning the targets in the site, and the Security Console has finished processing the scan results. If a scan has this state but there are no scan results displayed, see Determining if scans with normal states are having problems to diagnose this issue.
Stopped: A user has manually stopped the scan before the Security Console could finish importing data from the Scan Engine. The data that the Security Console had imported before the stop is integrated into the scan database, whether or not the scan has completed for an individual asset. You cannot resume a stopped scan. You will need to run a new scan.
Paused: One of the following events occurred:
In all cases, the Security Console processes results for targets that have a status of Completed Successfully at the time the scan is paused. You can resume a paused scan manually.
Note: When you resume a paused scan, the application will scan any assets in that site that did not have a status of Completed Successfully at the time you paused the scan. Since it does not retain the partial data for the assets that did not reach the completed state, it begins gathering information from those assets over again on restart.
Failed: A scan has been disrupted due to an unexpected event. It cannot be resumed. An explanatory message will appear with the Failed status. You can use this information to troubleshoot the issue with Technical Support. One cause of failure can be the Security Console or Scan Engine going out of service. In this case, the Security Console cannot recover the data from the scan that preceded the disruption.
Another cause could be a communication issue between the Security Console and Scan Engine. The Security Console typically can recover scan data that preceded the disruption. You can determine if this has occurred by one of the following methods:
Aborted: A scan has been interrupted due to crash or other unexpected events. The data that the Security Console had imported before the scan was aborted is integrated into the scan database. You cannot resume an aborted scan. You will need to run a new scan.
If a scan has an In progress status for an unusually long time, this may indicate that the Security Console cannot determine the actual state of the scan due to a communication failure with the Scan Engine. To test whether this is the case, try to stop the scan. If a communication failure has occurred, the Security Console will display a message indicating that no scan with a given ID exists.
If a scan has a Completed successfully status, but no data is visible for that scan, this may indicate that the Scan Engine has stopped associating with the scan job. To test whether this is the case, try starting the scan again manually. If this issue has occurred, the Security Console will display a message that a scan is already running with a given ID.
In either of these cases, contact Technical Support.
If you are a user with appropriate site permissions, you can pause, resume or stop manual scans and scans that have been started automatically by the application scheduler.
You can pause, resume, or stop scans in several areas:
To pause a scan, click the Pause icon for the scan on the Home, Sites, or specific site page; or click the Pause Scan button on the specific scan page.
A message displays asking you to confirm that you want to pause the scan. Click OK.
To resume a paused scan, click the Resume icon for the scan on the Home, Sites, or specific site page; or click the Resume Scan button on the specific scan page. The console displays a message, asking you to confirm that you want to resume the scan. Click OK.
To stop a scan, click the Stop icon for the scan on the Home, Sites, or specific site page; or click the Stop Scan button on the specific scan page. The console displays a message, asking you to confirm that you want to stop the scan. Click OK.
The stop operation may take 30 seconds or more to complete pending any in-progress scan activity.
The Security Console lists scan results by ascending or descending order for any category depending on your sorting preference. In the Asset Listing table, click the desired category column heading, such as Address or Vulnerabilities, to sort results by that category.
Two columns in the Asset Listing table show the numbers of known exposures for each asset. The column with the  ™ icon enumerates the number of vulnerability exploits known to exist for each asset. The number may include exploits available in Metasploit and/or the Exploit Database. The column with the
  icon enumerates the number of malware kits that can be used to exploit the vulnerabilities detected on each asset.
Click the link for an asset name or address to view scan-related, and other information about that asset. Remember that the application scans sites, not asset groups, but asset groups can include assets that also are included in sites.
To view the results of a scan, click the link for a site’s name on the Home page. Click the site name link to view assets in the site, along with pertinent information about the scan results. On this page, you also can view information about any asset within the site by clicking the link for its name or address.
To troubleshoot problems related to scans or to monitor certain scan events, you can download and view the log for any scan that is in progress or complete.
Scan log files have a .log extension and can be opened in any text editing program. A scan log’s file name consists of three fields separated by hyphens: the respective site name, the scan’s start date, and scan’s start time in military format. Example: localsite-20111122-1514.log.
If the site name includes spaces or characters not supported by the name format, these characters are converted to hexadecimal equivalents. For example, the site name my site would be rendered as my_20site in the scan log file name.
The following characters are supported by the scan log file format:
The file name format supports a maximum of 64 characters for the site name field. If a site name contains more than 64 characters, the file name only includes the first 64 characters.
You can change the log file name after you download it. Or, if your browser is configured to prompt you to specify the name and location of download files, you can change the file name as you save it to your hard drive.
You can find and download scan logs wherever you find information about scans in the Web interface. You can only download scan logs for sites to which you have access, subject to your permissions.
To download a scan log click the Download icon for a scan log.
A pop-up window displays the option to open the file or save it to your hard drive. You may select either option.
If you do not see an option to open the file, change your browser configuration to include a default program for opening a .log file. Any text editing program, such as Notepad or gedit, can open a .log file. Consult the documentation for your browser to find out how to select a default program.
To ensure that you have a permanent copy of the scan log, choose the option to save it. This is recommended in case the scan information is ever deleted from the scan database.
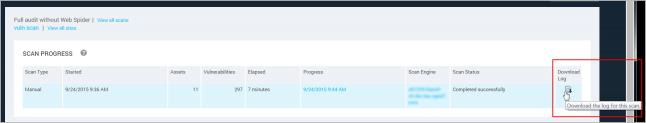
Downloading a scan log
While the Web interface provides useful information about scan progress, you can use scan logs to learn more details about the scan and track individual scan events. This is especially helpful if, for example, certain phases of the scan are taking a long time. You may want to verify that the prolonged scan is running normally and isn't "hanging". You may also want to use certain log information to troubleshoot the scan.
This section provides common scan log entries and explains their meaning. Each entry is preceded with a time and date stamp; a severity level (DEBUG, INFO, WARN, ERROR); and information that identifies the scan thread and site.
The beginning and completion of a scan phase
2013-06-26T15:02:59 [INFO] [Thread: Scan default:1] [Site: Chicago_servers] Nmap phase started.
The Nmap (Network Mapper) phase of a scan includes asset discovery and port-scanning of those assets. Also, if enabled in the scan template, this phase includes IP stack fingerprinting.
2013-06-26T15:25:32 [INFO] [Thread: Scan default:1] [Site: Chicago_servers] Nmap phase complete.
The Nmap phase has completed, which means the scan will proceed to vulnerability or policy checks.
Information about scan threads
2013-06-26T15:02:59 [INFO] [Thread: Scan default:1] [Site: Chicago_servers] Nmap will scan 1024 IP addresses at a time.
This entry states the maximum number of IP addresses each individual Nmap process will scan before that Nmap process exits and a new Nmap process is spawned. These are the work units assigned to each Nmap process. Only 1 Nmap process exists per scan.
2013-06-26T15:04:12 [INFO] [Thread: Scan default:1] [Site: Chicago_servers] Nmap scan of 1024 IP addresses starting.
This entry states the number of IP addresses that the current Nmap process for this scan is scanning. At a maximum, this number can be equal to the maximum listed in the preceding entry. If this number is less than the maximum in the preceding entry, that means the number of IP addresses remaining to be scanned in the site is less than the maximum. Therefore, the process reflected in this entry is the last process used in the scan.
Information about scan tasks within a scan phase
2013-06-26T15:04:13 [INFO] [Thread: Scan default:1:nmap:stdin] [Site: Chicago_servers] Nmap task Ping Scan started.
A specific task in the Nmap scan phase has started. Some common tasks include the following:
2013-06-26T15:04:44 [INFO] [Thread: Scan default:1:nmap:stdin] [Site: Chicago_servers] Nmap task Ping Scan is an estimated 25.06% complete with an estimated 93 second(s) remaining.
This is a sample progress entry for an Nmap task.
Discovery and port scan status
2013-06-26T15:06:04 [INFO] [Thread: Scan default:1:nmap:stdin] [Site: Chicago_servers] [10.0.0.1] DEAD (reason=no-response)
The scan reports the targeted IP address as DEAD because the host did not respond to pings.
2013-06-26T15:06:04 [INFO] [Thread: Scan default:1:nmap:stdin] [Site: Chicago_servers] [10.0.0.2] DEAD (reason=host-unreach)
The scan reports the targeted IP address as DEAD because it received an ICMP host unreachable response. Other ICMP responses include network unreachable, protocol unreachable, administratively prohibited. See the RFC4443 and RFC 792 specifications for more information.
2013-06-26T15:07:45 [INFO] [Thread: Scan default:1:nmap:stdin] [Site: Chicago_servers] [10.0.0.3:3389/TCP] OPEN (reason=syn-ack:TTL=124)
2013-06-26T15:07:45 [INFO] [Thread: Scan default:1:nmap:stdin] [Site: Chicago_servers] [10.0.0.4:137/UDP] OPEN (reason=udp-response:TTL=124)
The preceding two entries provide status of a scanned port and the reason for that status. SYN-ACK reflects a SYN-ACK response to a SYN request. Regarding TTL references, if two open ports have different TTLs, it could mean that a man-in-the-middle device between the Scan Engine and the scan target is affecting the scan.
2013-06-26T15:07:45 [INFO] [Thread: Scan default:1:nmap:stdin] [Site: Chicago_servers] [10.0.0.5] ALIVE (reason=echo-reply:latency=85ms:variance=13ms:timeout=138ms)
This entry provides information on the reason that the scan reported the host as ALIVE, as well as the quality of the network the host is on; the latency between the Scan Engine and the host; the variance in that latency; and the timeout Nmap selected when waiting for responses from the target. This type of entry is typically used by Technical Support to troubleshoot unexpected scan behavior. For example, a host is reported ALIVE, but does not reply to ping requests. This entry indicates that the scan found the host through a TCP response.
The following list indicates the most common reasons for discovery and port scan results as reported by the scan:
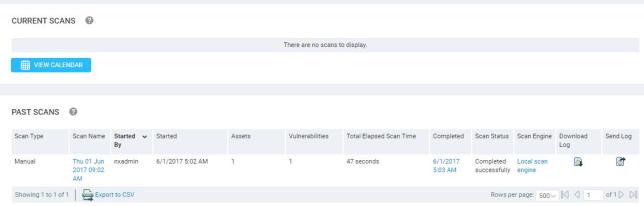
You can quickly browse the scan history for your entire deployment by seeing the Scan History page.
On any page of the Web interface, click the Administrationicon. On the Administration page, click the view link for Scan History.
The interface displays the Scan History page, which lists all scans, plus who started or restarted the scan, the total number of scanned assets, discovered vulnerabilities, and other information pertaining to each scan. You can click the date link in the Completed column to view details about any scan.
You can download the log for any scan as discussed in the preceding topic.
Viewing scan history