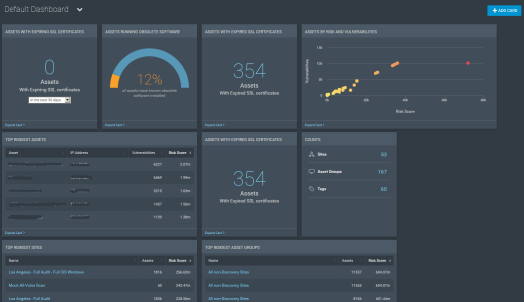
Dashboards provide visibility into assets, vulnerabilities, remediations, scans, and software found by Nexpose. At a glance, you can get a dynamic and detailed picture of the aspects of your security landscape that are most important to you.
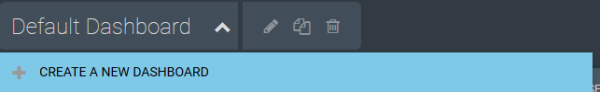
To add a new, blank dashboard, click the downward-facing arrow next to the name of the dashboard you are currently viewing, then click the first item on the list, Create a New Dashboard.
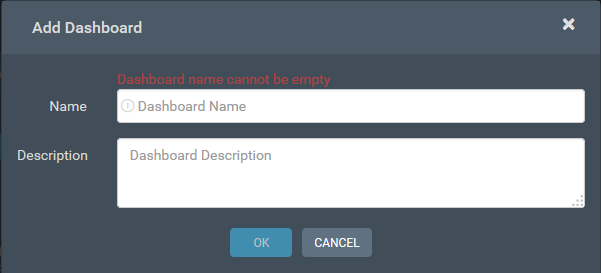
Add a name (required) and a description (optional) for the new dashboard, then click OK.
Your dashboard will be added and ready to use.
In addition to the ability to add a blank new dashboard, there are several built-in options for dashboards that can be added. These dashboard templates can be viewed, searched for, and added under the Dashboard Library menu. To access the Dashboard Library menu, click the downward-facing arrow next to the name of the dashboard you are currently viewing, then click the last item on the list, See More in the R7 Library.
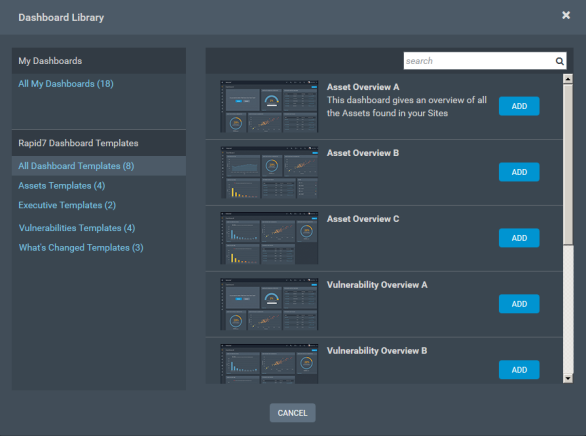
There, you will be able to add a new dashboard using the template of your choice by clicking the Add button for that template. Add a name (required) and a description (optional) for the new dashboard, then click OK. Your dashboard will be added and ready to use.
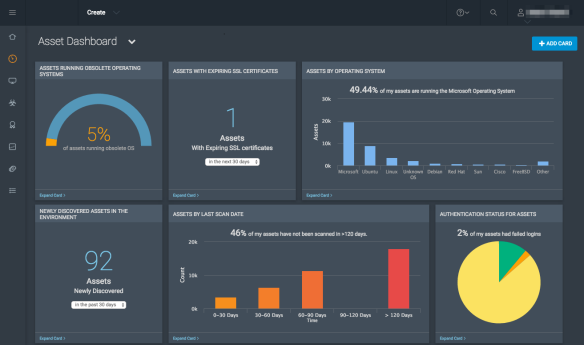
These dashboards give an overview of all the Assets found in your Sites, including such information as environment status, freshness of asset data, changing risk in assets, and prioritization of assets. There are three such templates for you to choose from.
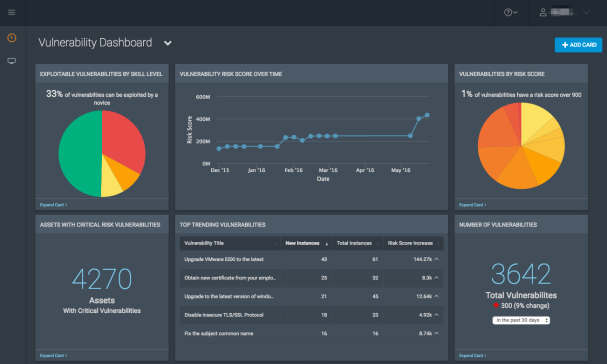
These dashboards provide an overview of all the vulnerabilities in your environment, including what is exploitable, changes in threat exposure, and slicing-and-dicing of vulnerability data. There are two templates in this category.
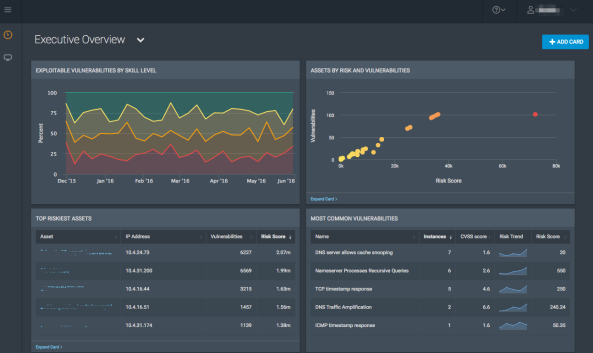
This dashboard displays an overall trend view of your threat exposure level, the performance of your teams, and the returning value of your investment.
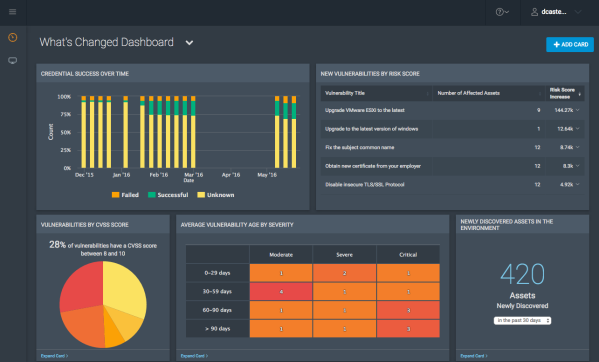
This dashboard focuses on recent information, including changes and trends, what has been newly discovered, and baseline data along with context.
In addition to using existing templates, you can also customize dashboards to your personal needs. See Customizing dashboards for more information.
Your session may time out after approximately ten (10) minutes of inactivity in the Dashboards feature. This may happen even if you are active in the Nexpose Console.
If a timeout occurs, you may see a blank screen or be unable to interact with data: for example, you may no longer be able to expand cards. To resolve the timeout, log out of your Nexpose Security Console and log in again.