Although the default Security Console settings should work for a broad range of network environments, you can change settings to meet specific scanning requirements.
Tip: Click Administer next to Console on the Administrationpage to launch the Security Console Configuration panel.
On the General page, you can view the version and serial numbers for the instance of the Security Console that you are using.
The Security Console runs its own Web server, which delivers the user interface.
To change the Security Console web server default settings:
It is recommended that you consult Technical Support first. In this context, threads refer to the number of simultaneous connections that the Security Console will allow. Typically a single browser session accounts for one thread. If simultaneous user demand is high, you can raise the thread counts to improve performance. The Security Console will increase the thread count dynamically if required, so manual increases may be unnecessary.
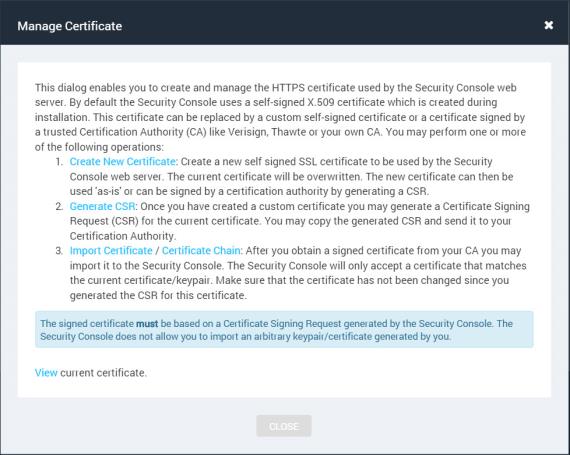
The application provides a self-signed X.509 certificate, which is created during installation. It is recommended that you replace it with a certificate that is signed by a trusted certifying authority (CA).
Note: The signed certificate must be based on an application-generated CSR. The application does not allow you to import an arbitrary key pair or certificate that you generated.
To manage certificates and generate a new certificate signing request (CSR):
The Security Console displays a box titled Manage Certificate.
Manage Certificate
The Security Console displays a box for new certificate information.

Manage Certificate–Create New Certificate
A dialog box appears indicating that a new self-signed certificate was created.
You can click Later to come back to this step and continue the process at another time.
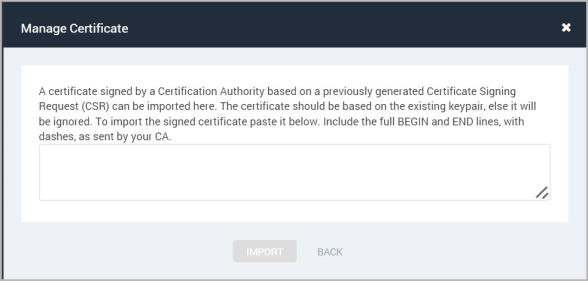
Manage Certificate–Import certificate signing request
The new certificate name appears on the Web Server page.
The Security Console communicates with distributed Scan Engines over a network to initiate scans and retrieve scan results. If you want to obtain scan status information more quickly or reduce bandwidth or resource consumption required for Security Console-to-Scan-Engine communication, you can tune various settings on the Scan Engines page of the Security Console Configuration panel. See the following sections:
The Security Console establishes connections with distributed Scan Engines to launch scans and retrieve scan results. This communication can be disrupted by low network bandwidth, high latency, or situations in which Scan Engines are performing high numbers of simultaneous scans. If any of these conditions exist in your environment, you may want to consider increasing connection settings on the Scan Engines configuration page:
Note: It is recommended that you consult with Technical Support before tuning these settings.
To configure these settings, take the following steps.
Tip: Because millisecond values can be difficult to read, a time value that is easier to read appears to the right of each value field. As you change either timeout value, note how the equivalent value changes.
You can create a pairing from a Scan Engine to a Security Console by creating a trusted connection between with them. A shared secret is a piece of data used so the console will recognize and trust the incoming communication from the engine.
Note: Each generated shared secret can be used by multiple engines. A shared secret is valid for 60 minutes from when it was generated. After 60 minutes, you will need to generate a new Shared Secret if you want to create additional trusted pairings.
To create a trusted pairing:
Ensure that no network-based or host-based firewall is blocking access to port 40815 on your Nexpose Security Console. If you want to use a port other than 40815, change this line in your console's nsc.xml file (\[installation directory]\nsc\conf\nsc.xml) to the port you want to use:
<EngineListener port="40815"/>
Restart your Security Console.
screen -r
add console 10.1.1.4
show consoles
connect to console 2
show consoles
For the console ID you just connected, the value of connectTo should be 1.
add shared secret 2
At the prompt, paste in the shared secret you copied from the Security Console.
You will see a verification message if the shared secret has been applied successfully.
enable console 2
You will see many lines logged as the pairing takes place.
By default, when you have created a trusted pairing with this method, the comunication direction will be from Engine to Console. To change it, see Changing Scan Engine communication direction in the Console.
You can change the direction of communication initiation between the Security Console and each remote Scan Engine. Which option is preferable depends on your network configuration. If the direction of communication is from Console to Engine, which is the default setting, the Security Console will initiate communication with the Scan Engine. If the direction of communication is from Engine to Console, the Scan Engine will actively notify the console that it is available. This option allows a Console that is behind a firewall and configured to allow inbound connections to have a communication channel with the Scan Engine.
Note: The Engine to Console option is not available for the Local Scan Engine or Hosted Engines.
To change the direction of Scan Engine communication:
![]()
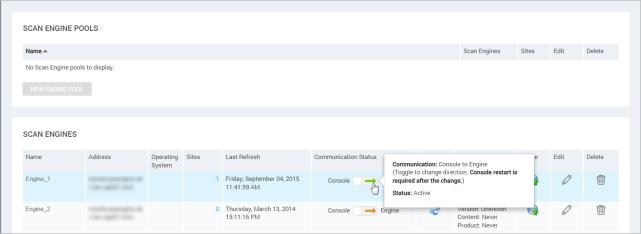
You can also hover the cursor over the arrow to view the current status of the communication.
The possible options are:
The console and engine could not communicate, but there was no error.
Note: This status sometimes appears when there has been a long time since the last communication. In this case, hovering over the arrow will cause a ping, and if that communication is successful the status will become Active.
Authorize communication from the Scan Engine. See Configuring distributed Scan Engines.
The console and engine are on different versions. Update them to the same version, or choose a different engine to pair.
The Scan Engine is not online. Perform troubleshooting steps to make it active again.
The Security Console allocates a thread pool for retrieving scan status information. You can adjust the number of threads, which corresponds to the number of scan status messages that the Security Console can retrieve simultaneously. For example, if you increase the number of distributed Scan Engines and the number of scans running simultaneously, you can increase the threads in the pool so that the Security Console can retrieve more status messages at the same time.
Note: It is recommended that you consult with Technical Support before tuning these settings.
Keep in mind that retrieval time is subject to network conditions such as bandwidth and latency. Whenever the number of active threads in use exceeds the overall number of threads in the pool, the Security Console removes unused scan status threads after specific time interval. If you notice an overall decrease in the frequency of scan status messages, you may want to consider increasing the timeout value.
To adjust pool settings for scan status threads, take the following steps:
Tip: Because millisecond values can be difficult to read, a time value that is easier to read appears to the right of each value field. As you change either timeout value, note how the equivalent value changes.
The Security Console communicates with Scan Engines over a network to retrieve scan results. By default, the Security Console retrieves scan results from distributed Scan Engines incrementally, displaying results in the Web interface as it integrates the data, rather than retrieving the full set of results after each scan completes. This allows you to view scan results as they become available while a scan is in progress.
Incremental retrieval modulates bandwidth usage throughout the scan. It also makes it unnecessary for the Security Console to retrieve all the data at the end of the scan, which could cause a significant, temporary increase in bandwidth usage, especially with large sets of data.
The Scan Engines page of the Security Console Configuration panel displays a check box for incremental retrieval of scan results. It is selected by default. Do not disable this option unless directed to do so by Technical Support.
You can view the name and type of the Security Console database on the Database page of the Security Console configuration panel. You also can change displayed database settings.
To save the changes, click Save.
The application’s database is a core component for all major operations, such as scanning, reporting, asset and vulnerability management, and user administration. The efficiency with which it executes these tasks depends heavily on database performance. The current PostgreSQL database version, 9.4.1, features a number of performance and stability enhancements. The application takes full advantage of these improvements to scale flexibly with the needs of your environment. Future releases will include powerful features that will require the latest PostgreSQL version.
Note: Only administrators can migrate the database.
If your installation is running an earlier version of PostgreSQL, you can easily migrate it to the latest version, using a tool in the Security Console Web interface.
Migration involves five required tasks:
Restoring a backup of an older platform-dependent PostgreSQL database after migrating to the new version is not supported. After you perform and verify the migration to the latest version and ensure database consistency, it is very important that you back up the database immediately to prevent the need to restore an earlier version of the database. See
This document also provides instructions for optional post-migration tasks:
Some preparation will ensure that migration takes the least possible amount of time and is successful:
restart command. In most cases the Start Migration button is disabled if you do not have enough disk space to perform the migration. However, in some environments, the Start Migration button may be enabled but disk space issues may still occur during migration. For example, see the section about Linux file systems. To free up disk space, try the solutions listed in the following sequence. Check if the Start Migration button is enabled after each step.
Note: It is recommended that your free disk space be equal to 1.6 GB + (1.3 x database_size).
Run the following database maintenance tasks, which remove unnecessary data and free up unused table space:
If you have not run these tasks recently, doing so may free up considerable space. It is recommended that you run each task individually in the following sequence. After completing each task, try running the migration again. Re-indexing may provide all the space you need, making it unnecessary to clean up the database or compress tables, which can take significant time depending on the size of your database. See Performing database maintenance.
Move the following directories from the host system, and restore them after the migration is complete:
Note: These directories and files take up increasing amounts of disk space over time as the application accumulates data.
To create free space for migration:
Note: If the disk space problem occurs after a previous migration attempt failed,
see
After taking the preceding steps, try starting the migration again. If you still don’t have enough disk space, contact Technical Support.
By default, Linux file systems reserve 5 percent of disk space for privileged, or root, processes. Although this reserved space is not available for database migration, the application includes it in the pre-migration calculation of total available space. As a result, a migration may be able to start, but then fail, because the actual amount of free disk space is lower than what was detected in the calculation. You can lower the amount of reserved disk space to make the amount of actual free space more consistent with the results of the pre-migration calculation. To do so, use the tune2fs utility. The command includes parameters for the percentage of reserved disk space and the partition on which the application is installed.
Example: tune2fs -m 1 /dev/sdf1
To monitor the migrations:
After you click Start Migration, the application goes into Maintenance Mode. Normal operations, such as scanning and running reports, are unavailable. See Running in maintenance mode. If you’re an administrator, you can log on to monitor migration status messages.
During migration, the application copies data from the old PostgreSQL database to the new PostgreSQL database. The migration requires enough disk space for both of these databases.
It also backs up the old PostgreSQL database and stores it in the directory [installation_directory]/nsc/nxpgsql-backup-[timestamp] after the migration completes.
The estimated migration time is based on the size of the database.
After all migration processes finish, the application restarts, and you can resume normal operations.
If you click the Cancel button to stop the migration before it completes, the application will discontinue the migration process. You can then restart the application in normal, operational mode.
If the migration fails, your current version of the PostgreSQL database will remain intact, and you can continue using the application without interruption. See
In very rare instances the application may display the migration FAQs while in Maintenance Mode after the migration process has been executed, instead of a status message detailing the results of the migration. If this occurs, contact Technical Support for assistance before restarting the server. You should also contact Technical Support if this situation occurred and you inadvertently restarted your server, or at any time after the migration if you note on the Database Migration page that the version of PostgreSQL running in your environment is earlier than 9.4.
Depending on the amount of data, the migration can take from 30 minutes to over an hour. Therefore, a long migration time is not unusual, and extended periods without new status messages do not necessarily indicate that the migration is “hanging.”
You can perform a couple of quick checks to confirm that the migration is still proceeding when no status messages are visible:
The Security Console will display a notification when the processes have completed.
To verify migration success, take the following steps:
If the migration was successful, the installed version will be 9.4.1.
OR
It will appear on a line that looks like the following example:
NSC 2015-06-11T18:45:01 PostgreSQL 9.4.1, compiled by Visual C++ build 1500, 64-bit
Upon confirming that the migration was successful, take the following steps:
It contains the pre-migration database, including the postgresql.conf file.
NOTE: Before you resume normal operations, make sure to verify database consistency as described in the following section.
If you modified postgresql.conf or pg_hba.conf prior to the migration you will need to reapply any custom settings to those configuration files. See
This procedure involves two steps. Checking database consistency and cleaning up the database take little time.
To verify database consistency and respond appropriately:
The Security Console displays the Troubleshooting page.
A table appears on the page, listing the results of all diagnostic tests. Red circles containing the letter X indicate consistency issues.
The Security Console displays the Database Maintenance page.
Note: All diagnostics options are selected by default, but only database diagnostics are necessary for verifying database consistency after migration. To see only the information you need for this task, clear any other selected check boxes.
Once you start these operations, the application shuts down and restarts in Maintenance Mode. Any in-progress scans or reports will stop before completion and any related data will be lost. You will have to rerun any reports or scans after it completes maintenance operations and restarts in Normal Mode. For more information, see Running in maintenance mode.
It is very important that you back up the database immediately after you verify the success of the migration and ensure database consistency. This preserves a baseline instance of the post-migration database and prevents the need to restore a backup of a PostgreSQL 9.0 database.
Perform this step only after you have completed the preceding steps:
For instructions on backing up the database, see Database backup/restore and data retention.
After migration, the application backs up the PostgreSQL 9.0 database and stores it in the directory [installation_directory]/nsc/nxpgsql-backup-[timestamp].
If you want to restore this particular database, take the following steps:
It is located in [installation_directory]/nsc/nxpgsql.
Tip: Move the backup directory with all original permissions attributes preserved. Doing so prevents the requirement on Linux that nxpgsql be the owner of the directory, as well as the necessity on Windows to give the system user access to the directory.
If you are planning to restore the database that was backed up during the migration, keep several things in mind:
If you run scans or reports after the migration and then restore the backup database, the Security Console Web interface will not list scan or report instances from the period between the migration and the restoration because the restored database does not contain those records.
When you start to run scans or reports after the restoration, the associated scan or report instances that are being populated in the restored database will overwrite the instances that were generated in the file system prior to the restoration.
Graphic charts will initially be out of synch with the restored database because they always reflect the latest site, scan, or asset group information. Each chart will refresh and synchronize with the restored database after an event associated with it. For example, running a scan will refresh and synchronize the charts for any associated sites or asset groups.
The PostgreSQL database applies its default settings after migration. If you previously modified the postgresql.conf file to tune database performance or the pg_hba.conf to enable remote connections to the database, you will need to reapply those modified settings.
After the migration is complete, you can refer to the configuration files in the old, archived version of PostgreSQL, which is stored in the directory [instsallation_directory]/nsc/nxpgsql-backup-[timestamp].
Warning: Do not simply copy the old configuration files into the new database location. This may prevent the database from starting due to compatibility issues. For each file, compare each setting one by one, and edit only the properties that you modified in the previous PostgreSQL installation.
If the migration fails, your current version of the PostgreSQL database will remain intact. Simply restart the application and resume normal operations.
Before you run the migration again, find out if the failure occurred due to disk space errors. In certain cases, migration may exceed available disk space before finishing, even if the automatic pre-migration check determined that sufficient disk space was available.
To troubleshoot a failed migration:
Note: If you do not wish to retry migration after failure, you should still delete the /nxpgsql-temp directory, because it uses up considerable disk space.
If the migration fails due to a system failure or power outage and you attempt to run the migration again, you may encounter a disk space limitation issue. This is because during the failed migration attempt, the application created an nxpgsql-temp directory. Simply delete this directory and start the migration again. The temp directory is located in [installation_directory]/nsc.
Note: Only global administrators are permitted to run the application in maintenance mode.
Maintenance mode is a startup mode in which the application performs general maintenance tasks and recovers from critical failures of one or more of its subsystems. During maintenance mode, you cannot run scans or reports. Available functions include logging, the database, and the Security Console Web interface.
Note: The application automatically runs in maintenance mode when a critical internal error occurs.
When the application is running in maintenance mode, you see the page /admin/maintenance/index.html upon logging on. This page shows all available maintenance tasks and indicates the current status of the task that is being performed. You cannot select a new task until the current task is completed. Afterward, you can switch tasks or click Restart to return to normal operating mode.
To work in Maintenance mode:
The Security Console displays the Maintenance Mode page.