This section provides descriptions of problems commonly encountered when using the application and guidance for dealing with them. If you do need to contact Technical Support, this section will help you gather the information that Support needs to assist you.
If you are encountering problems with the Security Console or Scan Engine, you may find it helpful to consult log files for troubleshooting. Log files can also be useful for routine maintenance and debugging purposes.
The section does not cover the scan log, which is related to scan events. See Viewing the scan log.
Log files are located in [installation_directory]/nsc/logs directory on the Security Console and [installation_directory]/nse/logs on Scan Engines. The following log files are available:
In earlier product versions, API information was stored in nsc.log.
Log files have the following format:
[yyyy-mm-ddThh:mm:ss GMT] [LEVEL] [Thread: NAME] [MESSAGE]
Example:
2011-12-20T16:54:48 [INFO] [Thread: Security Console] Security Console started in 12 minutes 54 seconds
The date and time correspond to the occurrence of the event that generates the message.
Every log message has a severity level:
When reading through a log file to troubleshoot major issues, you may find it useful look for ERROR- and WARN-level messages initially.
Thread identifies the process that generated the message.
By default, all log files display messages with severity levels of INFO and higher. This means that they display INFO, WARN, ERROR messages and do not display DEBUG messages. You can change which severity levels are displayed in the log files. For example, you might want to filter out all messages except for those with WARN and ERROR severity levels. Or, you may want to include DEBUG messages for maintenance and debugging purposes.
Configuration steps are identical for the Security Console and distributed Scan Engines. To configure which log severity levels are displayed, take the following steps:
Note: In the user-log-settings.xml file, default refers to the nsc.log file or nse.log file, depending on whether the installed component is the Security Console or a distributed Scan Engine.
<!-- and -->:<!-- <property name="default-level" value="INFO"/> -->
<property name="default-level" value="DEBUG"/><property name="default-level" value="DEBUG"/>
<property name="auth-level" value="DEBUG"/>
<property name="access-level" value="DEBUG"/>
<property name="mem-level" value="DEBUG"/>
The change is applied after approximately 30 seconds.
You can transmit logs generated by Scan Engines to Technical Support by clicking Send Logs on the Troubleshooting page.
Note: An optional SMTP (e-mail) transport mechanism is also supported when a direct link is unavailable. Contact Technical Support for more information.
To send logs:
The Security Console displays a box for uploading the logs.
The message may refer to scan errors, a support case, or a report of aberrant system behavior.
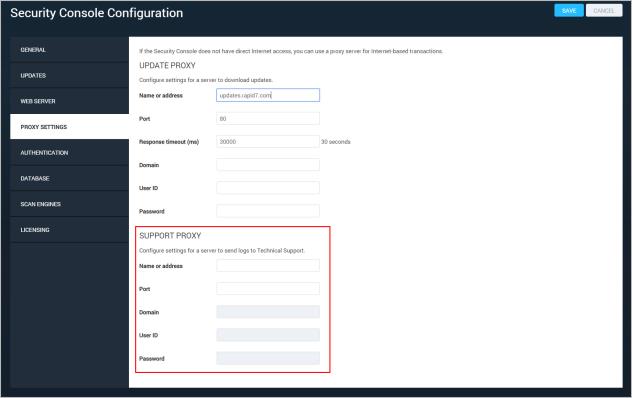
If the Security Console does not have direct Internet access, you can use a proxy server for sending logs to Technical Support.
To configure proxy settings for updates:
The Administration page appears.
The Security Console Configuration panel appears.
Security Console Configuration panel - Proxy Settings for sending logs to Technical Support
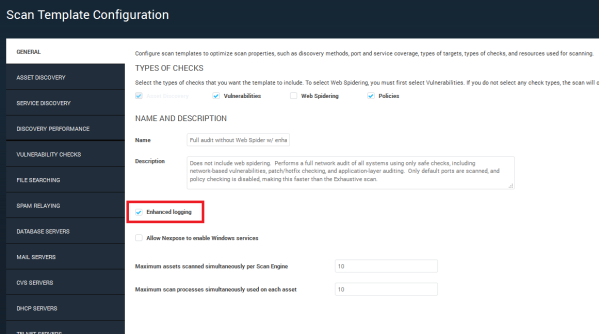
If your scans are producing inaccurate results, such as false positives, false negatives, or incorrect fingerprints, you can use a scan logging feature to collect data that could help the Technical Support team troubleshoot the cause. Enhanced logging is a feature that collects information useful for troubleshooting, such as Windows registry keys, SSH command executions, and file versions, during a scan.
Following is a sample from an Enhanced logging file:
<ace:collected_object>
<ace:source-id>0</ace:source-id>
<ace:thread-activity>do-unix-create-system-fingerprint@example.com:22</ace:thread-activity>
<ace:remote_execution_item id="42">
<ace:command>freebsd-version</ace:command>
<ace:rc datatype="int">0</ace:rc>
<ace:stdin status="does not exist"/>
<ace:stdout>10.0-RELEASE
</ace:stdout>
<ace:stderr status="does not exist"/>
<ace:start_time datatype="int">1443208125966</ace:start_time>
<ace:end_time datatype="int">1443208125982</ace:end_time>
</ace:remote_execution_item>
</ace:collected_object>
Using this feature involves two major steps:
Note: It is recommended that you scan individual assets or small sites with Enhanced Logging enabled.
Enhanced Logging is enabled by default on the Asset Configuration Export scan template. You may, however, want to scan with a custom template which has been tuned to perform better in your specific environment. To enable Enhanced logging on a custom scan template:
If you want to scan an entire site with the template, add it to a site configuration and then scan the site. See Selecting a scan template.
Note: Enhanced logging gathers a significant amount of data, which may impact disk space, depending on the number off assets you scan.
If you want to manually scan a specific asset with the template, add the template in the scan dialog. See Running a manual scan .
Each scan with Enhanced logging enabled stores a Zip archive of Enhanced logging data in your scan directory. You can find it at:
[installation_directory]/nse/scans/[silo_ID]/[scan_ID]/ACES.zip.
Example:
/opt/rapid7/nexpose/nexpose/nse/scans/00000000/0000000000000001$/ACES.zip
To determine the specific scan ID, take the following steps:
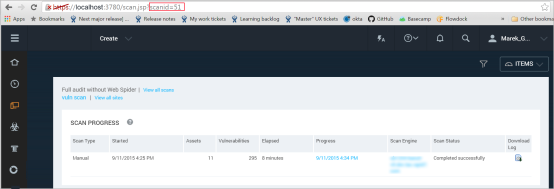
Determining your scan ID
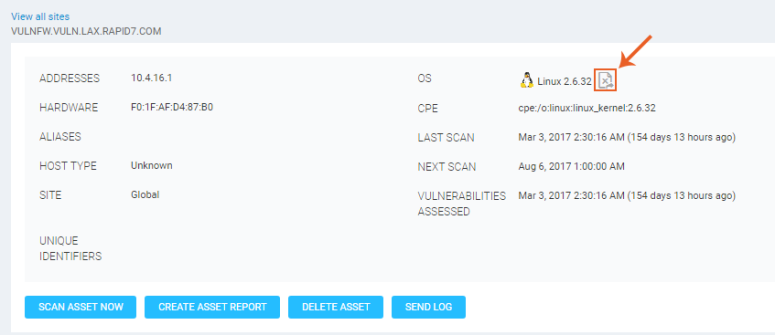
You can report incorrectly fingerprinted Operating Systems by clicking on the Report an incorrectly identified asset icon next to the listed OS on the Asset or Node page.
You can run several diagnostic functions to catch issues that may be affecting system performance.
To run diagnostics for internal application issues:
The Security Console displays the Troubleshooting page.
After performing the requested diagnostics, the Security Console displays a table of results. Each item includes a red or green icon, indicating whether or not an issue exists with the respective system component.
If a subsystem critical error occurs during startup, then the application will attempt to queue an appropriate maintenance task to respond to that failure. Afterward, it restarts in maintenance mode.
If you are an administrator, you can log on and examine the cause of failure. If required, you can take certain steps to troubleshoot the issue.
Two types of recovery tasks are available:
The application may fail to restart in maintenance mode in case of extremely critical failures if the maintenance Web server does not have the default port 3780 available. This may happen if there is already an instance of it running, or if one or more of the key configuration files is invalid or missing. These files have extensions such as .nsc, .xml, and .userdb.
When the Web interface session times out in an idle session, the Security Console displays the logon window so that the user can refresh the session. If a communication issue between the Web browser and the Security Console Web server prevents the session from refreshing, a user will see an error message. If the user has unsaved work, he or she should not leave the page or close the browser because the work may not be lost after the communication issue is resolved.
A communication failure may occur for one of the following reasons. If any of these is the cause, take the appropriate action:
An extreme delay in the Security Console’s response to the user’s request to refresh the session also may cause the failure message to appear.
When a user attempts to log on too many times with an incorrect password, the application locks out the user until the lockout is reset for that user.
The default lockout threshold is 4 attempts. A global administrator can change this parameter on the Security Console Configuration—Web Server page. See Changing the Security Console Web server default settings.
You can reset the lockout using one of the following three methods:
unlock account.
Using the command console.Occasionally, a scan will take an unusually long time, or appear to have completely stopped.
It is not possible to predict exactly how long a scan should take. Scan times vary depending on factors such as the number of target assets and the thoroughness or complexity of the scan template. However, you can observe whether a scan is taking an exceptionally long time to complete by comparing the scan time to that of previous scans.
In general, if a scan runs longer than eight hours on a single host, or 48 hours on a given site, it is advisable to check for certain problems.
If you attempt to start, pause, resume, or stop a scan, and a message appears for a long time indicating that the operation is in progress, this may be due to a network-related delay in the Security Console's communication with the Scan Engine. In networks with low bandwidth or high latency, delayed scan operations may result in frequent time-outs in Security Console/Scan Engine communication, which may cause lags in the Security Console receiving scan status information. To reduce time-outs, you can increase the Scan Engine response time out setting. See Configuring Security Console connections with distributed Scan Engines.
Scans can be slow, or can fail, due to memory issues. See Out-of-memory issues.
For every target host that it discovers, the application scans its ports before running any vulnerability checks. The range of target ports is a configurable scan template setting. Scan times increase in proportion to the number of ports scanned.
In particular, scans of UDP ports can be slow, since the application, by default, sends no more than two UDP packets per second in order to avoid triggering the ICMP rate-limiting mechanisms that are built into TCP/IP stacks for most network devices.
To increase scan speed, consider configuring the scan to only examine well-known ports, or specific ports that are known to host relevant services. See Working with scan templates and tuning scan performance.
If the Scan Engine goes off line during the scan, the scan will appear to hang. When a Scan Engine goes off line during the scan, the database will need to remove data from the incomplete scan. This process leaves messages similar to the following the scan log:
DBConsistenc3/10/09 12:05 PM: Inconsistency discovered for dispatched scan ID 410, removing partially imported scan results...
If a Scan Engine goes offline, restart it. Then, go the Scan Engine Configuration panel to confirm that the Scan Engine is active. See Configuring distributed Scan Engines.
You can view an activity log for a scan that is in progress or complete.
To view the scan log:
The console displays the scan log.
If another user stops a scan, the scan will appear to have hung. To determine if this is the case, examine the log for a message similar to the following:
Nexpose3/16/09 7:22 PM: Scan [] stopped: "maylor" <>
See Viewing the scan log.
Occasionally, report generation will take an unusually long time, or appear to have completely stopped. You can find reporting errors in the Security Console logs.
Report generation can be slow, or can fail, due to memory issues. See Out-of-memory issues.
Database speed affects reporting speed. Over time, data from old scans will accumulate in the database. This causes the database to slow down.
If you find that reporting has become slow, look in the Security Console logs for reporting tasks whose durations are inconsistent with other reporting tasks, as in the following example:
nsc.log.0:Reportmanage1/5/09 3:00 AM: Report task serviceVulnStatistics finished in 2 hours 1 minute 23 seconds
You can often increase report generation speed by cleaning up the database. Regular database maintenance removes leftover scan data and host information. See Viewing the scan log and Database backup/restore and data retention.
Scanning and reporting are memory-intensive tasks, so errors related to these activities may often be memory issues. You can control memory use by changing settings. Some memory issues are related how system resources are controlled.
If the application has crashed, you can verify that the crash was due to lack of memory by checking the log files for the following message:
java.lang.OutOfMemoryError: Java heap space
If you see this message, contact Technical Support. Do not restart the application unless directed to do so.
Since scanning is memory-intensive and occurs frequently, it is important to control how much memory scans use so that memory issues do not, in turn, affect scan performance. There are a number of strategies for ensuring that memory limits do not affect scans.
As the number of target hosts increases, so does the amount of memory needed to store scan information. If the hosts being scanned have an excessive number of vulnerabilities, scans could hang due to memory shortages.
To reduce the complexity of a given scan, try a couple of approaches:
After patching any vulnerabilities uncovered by one scan, add the excluded IP addresses or vulnerabilities to the site configuration, and run the scan again.
For more information, see Configuring distributed Scan Engines and Working with scan templates and tuning scan performance .
Running several simultaneous scans can cause the Security Console to run out of memory. Reduce the number of simultaneous scans to conserve memory.
If scans are consistently running out of memory, consider adding more memory to the servers. To add memory, it might be necessary to upgrade the server operating system as well. On a 64-bit operating system, the application can address more memory than when it runs on a 32-bit operating system. However, it requires 8 Gb of memory to run on a 64-bit operating system.
See the following chapters for more detailed information on making scans more memory-friendly:
Occasionally, system updates will be unsuccessful. You can find out why by examining the system logs.
The application keeps track of previously-applied updates in an update table. If the update table becomes corrupt, the application will not know which updates need to be downloaded and applied.
If it cannot install updates due to a corrupt update table, the Scan Console log will contain messages similar to the following:
AutoUpdateJo3/12/09 5:17 AM: NSC update failed: com.rapid7.updater.UpdateException: java.io.EOFException
at com.rapid7.updater.UpdatePackageProcessor.getUpdateTable(Unknown Source)
at com.rapid7.updater.UpdatePackageProcessor.getUpdates(Unknown Source)
at com.rapid7.updater.UpdatePackageProcessor.getUpdates(Unknown Source)
at com.rapid7.nexpose.nsc.U.execute(Unknown Source)
at com.rapid7.scheduler.Scheduler$_A.run(Unknown Source)
If this occurs, contact Technical Support. See Viewing the scan log.
By default, the application automatically downloads and installs updates. The application may download an update, but its installation attempt may be unsuccessful.
You can find out if this happened by looking at the scan log.
Check for update time stamps that demonstrate long periods of inactivity.
AU-BE37EE72A11/3/08 5:56 PM: updating file: nsc/htroot/help/html/757.htm
NSC 11/3/08 9:57 PM: Logging initialized (system time zone is SystemV/PST8PDT)
You can use the update now command prompt to re-attempt the update manually:
The Command Console page appears.
update now in the text box and click Execute. The Security Console displays a message to indicate whether the update attempt was successful. See Viewing the scan log.
If the application cannot perform an update due to a corrupt file, the Scan Console log will contain messages similar to the following:
AU-892F7C6793/7/09 1:19 AM: Applying update id 919518342
AU-892F7C6793/7/09 1:19 AM: error in opening zip file
AutoUpdateJo3/7/09 1:19 AM: NSC update failed: com.rapid7.updater.UpdateException:
java.util.zip.ZipException: error in opening zip file
at com.rapid7.updater.UpdatePackageProcessor.B(Unknown Source)
at com.rapid7.updater.UpdatePackageProcessor.getUpdates(Unknown Source)
at com.rapid7.updater.UpdatePackageProcessor.getUpdates(Unknown Source)
at com.rapid7.nexpose.nsc.U.execute(Unknown Source)
at com.rapid7.scheduler.Scheduler$_A.run(Unknown Source)
If the update fails due to a corrupt file, it means that the update file was successfully downloaded, but was invalid. If this occurs, contact Technical Support. See Viewing the scan log.
If a connection between the Security Console and the update server cannot be made, it will appear in the logs with a message similar to the following.
AU-A7F0FF3623/10/09 4:53 PM: downloading update: 919518342
AutoUpdateJo3/10/09 4:54 PM: NSC update failed: java.net.SocketTimeoutException
The java.net.SocketTimeoutException is a sign that a connection cannot be made to the update server. If the connection has been interrupted, other updates prior to the failure will have been successful.
You can use the update now command prompt to re-attempt the update manually. See
Interrupted update and
Viewing the scan log.