Endpoint Monitoring with InsightIDR
According to a study by industry analysts at IDC, 70 percent of successful breaches start on the endpoint. An endpoint is the final point in a communication path, for example, a computer, user account, etc. Attackers often phish users and leverage local machine credentials to move laterally across the network in ways invisible to traditional monitoring tools. While user behavior across the network and in the cloud is important, it cannot be complete without monitoring activities on endpoints.
One of the key sources of InsightIDR’s knowledge of the network environment comes from endpoints. The workstations and laptops in the network, as well as the servers when viewed from the perspective of computers with logon histories and running processes, provide excellent visibility into many aspects of the network that can’t be gathered by monitoring network appliances or even Active Directory logs. Some of the information that can be gathered directly from endpoints includes: software processes running within the environment, logon histories as users use both domain and local credentials to connect to systems and move laterally across them, account impersonations when a user logged in with one account and then authenticates to a different account, and other potentially suspicious activity.
The Endpoint Monitor is a unique Event Source in the InsightIDR Collector infrastructure in that it acts as a scanner to query endpoints across the network for the data that allows the system to monitor and report on the above activity.
Key Features
Once an Endpoint Scan has been installed on a Collector, several new features become available in InsightIDR. Rapid7 is introducing a new Continuous Agent as well as a new Endpoint Scan. The new agent provides several new capabilities including remote monitoring of assets (VPN) and the ability to run forensic jobs both remote and local.
Processes
In most organizations, it’s rare that users have unique applications that only they use. Most applications, such as office packages and other standard applications, are installed on dozens if not hundreds or thousands of computers. Specific hacking tools or malware, on the other hand, are only present on one or a handful of machines. Seen across the entire user population, unique and rare processes become obvious and provide a good indication that a user has either contracted malware or is running rogue software. This is especially valuable in today’s world where malware has become adept at evading antivirus detection techniques.
Processes running on endpoint computers can be reviewed several different ways.
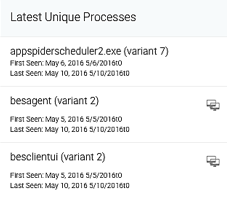
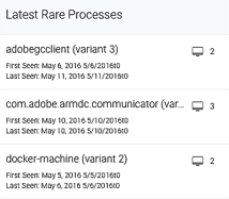
Latest Unique Processes and Rare Processes
Latest Unique Processes and Rare Processes are displayed from either the Assets & Endpoints page or from the Users and Accounts page. A unique process is seen on a single asset on the network. A rare process is seen on a few assets on the network. The exact number between "rare" and "uncommon" is deliberately left vague since Rapid7 may decide to change the threshold based on the results we're seeing in the field.
These processes, when they were running, and the systems on which they were discovered, are presented to the security administrator for review to ensure they are not risky software or malware that has evaded other security tools.
Viewing the Latest Unique and Rare Processes from the Assets and Endpoints page
Click Assets & Endpoints from the InsightIDR menu.

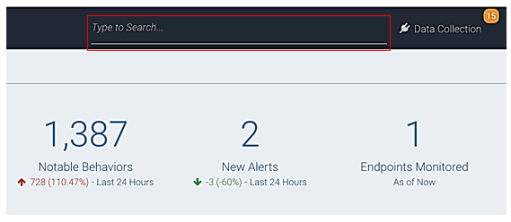
The Assets & Endpoint page displays. The Latest Unique Processes and Latest Rare Processes tiles display the relevant information.
You can also access these metrics by clicking the related metric at the top of the Assets and Endpoints page.

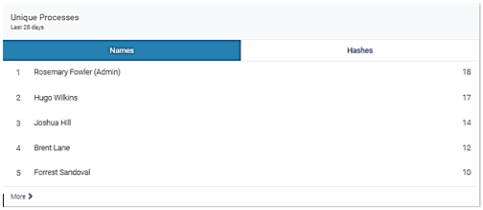
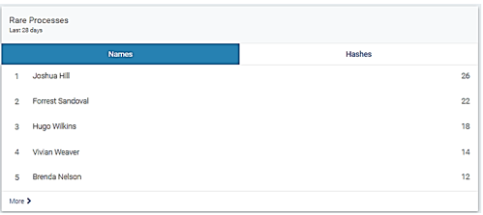
Viewing the Latest Unique and Rare Processes from the Users and Accounts page
Click Users & Accounts from the InsightIDR menu.

The Users & Accounts page displays. Scroll down to view Unique and Rare Processes data.
Searching for processes
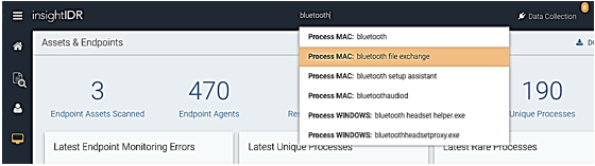
You can use the Search bar at the top of the page to search for any process name, such as ‘bluefish.exe’.
After you type the first few letters of a process name, the search bar provides the full name of any processes it has discovered on the network that match the text provided. Searching for a process returns all users and machines running the target process, if any.
Clicking a process provides more details about that process, including the various MD5 variants that have been discovered on the network (if the Endpoint Scan is enabled), a timeline when the process has been seen, and which assets the process has been seen.
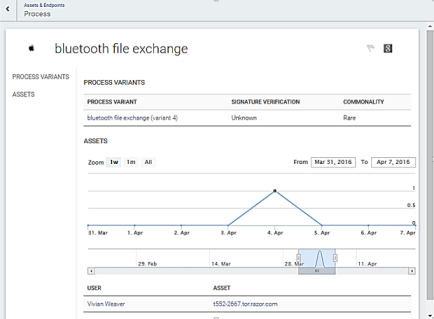
If the Endpoint Scan is enabled, clicking each variant provides some information about that particular binary, such as the MD5 hash for the executable, the publisher, the signature, and the timeline and machines found running that particular variant. The SHA1 or MD5 hash can also be pasted into the Search bar to discover if any systems on the network have been discovered running that binary.
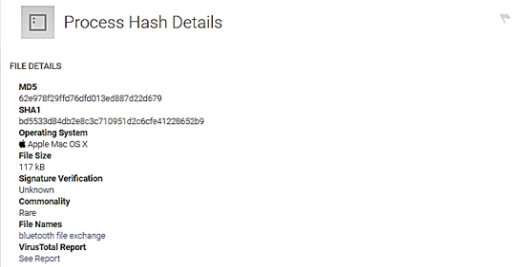
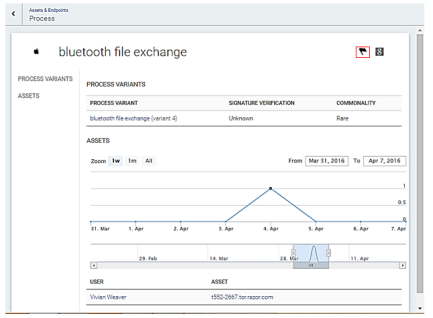
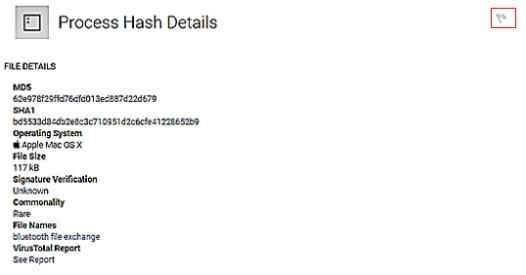
Both the process details page and the process hash page provide the opportunity to flag the process or a variant of the process. Once flagged, if the process is discovered on any other systems on the network, an incident is generated.
Bandwidth impact
For most environments, there is no noticeable bandwidth impact because the scanner enforces a 30-minute cool down period between each scan. Since a typical scan takes between 30-60 minutes, each asset is generally scanned only every hour or two. For extremely low-bandwidth environments, bandwidth can be a consideration. The Endpoint Scan takes about 300kb per asset per scan to gather endpoint information. If the Endpoint Scan is deployed, there is an additional 10MB transfer per scan. So for environments with tight bandwidth constraints, it may be preferable to turn off the Endpoint Scan functionality.
Scanning with multiple endpoint scans
For some network topologies, it makes sense to configure multiple Endpoint Scans to share the responsibility for scanning the entire network. A single collector can handle about 16,000 endpoints scanned per CPU that it has available. For very large deployments, multiple Endpoint Scans should be configured to split up the work. For the Endpoint Scan to work, it must be able to establish a WMI (Windows) or Secure Shell (SSH) (Mac) connection with the endpoints, and the endpoints must be able to initiate a connection back to the collector somewhere in the 20000-30000 port range. Firewall rules may require that more than one Endpoint Scan be configured so that the endpoints can be reached by the Endpoint Scan’s collector.
Each collector is only responsible for a single scanner per OS type, so each is configured to have a single Windows and a single Macintosh Endpoint Scan. In order to deploy multiple Endpoint Scans of the same OS type across a network, a host machine collector is set up for each.
Windows and Linux collectors can be used to host Windows and Mac Endpoint Scans.
What's Next?